 Recap
Recap
Recap is a collection of software modules which monitor the resources on your host computer system. The design is such that you can leave it up and running all the time. Recap is very light-weight and its presence should have no noticeable impact on your system performance.
Download
Download Version 1.0.7.0 (Apr 29, 2019)
Note: If upgrading from v1.0.6.3, it is STRONGLY recommended that you manually uninstall the previous version before installing the current. Installer formats were changed which made a seemless upgrade process impossible.
Clock Module
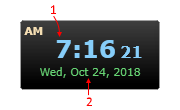
The clock module is just what it claims to be.
- Local time on your system. This can be adjusted to be either 12/24 hour.
- Current date. The format of the date can be adjusted to your preferences.
CPU Module
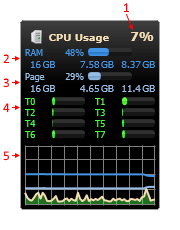
The CPU module is your system's processor and memory wrapped up into a view you can assess with a glance. Let's break it down from top to bottom:
- Overall CPU usage presented as a percent. This is essentially an average of the usage levels over all your CPU cores.
- RAM usage data. This is your systems main memory. All running applications (foreground and background) consume some amount of your system's RAM. Usage is presented as a percent with a visual bar indicator to the right. Below the bar are some numerics which represent (from left to right) Total Available, Used Amount, Free Amount (you can mouse over the numbers in Recap to get a reminder).
- Page usage data. The page file is your system's virtual memory. As your operating system feels pressure on RAM it can move some application data from RAM into Page at its discretion. Page usage data is presented exactly the same as RAM usage data above, except in a different color.
- Core/Thread usage data. All modern CPUs are a collection of discrete processing cores. Recap detects how many virtual processing units are active in your host system and presents each as a data point in the CPU module. Each will be labeled with either "T" (indicating an Intel architecture using hyperthreaded cores) or "C" (indicating a non-hyperthreaded processing unit). The current utilization level of each processing unit will be displayed as a bar or a percent. You can switch between modes by clicking on any of the "core units" in the UI.
- CPU / Memory Chart. This chart presents 3 data series for your viewing pleasure. The colors of these series match the colors of the data they represent in the CPU module, e.g.: The dark blue series corresponds to the RAM usage of your host system, the light blue series corresponds to your Page file usage, and the tan series corresponds to overall CPU usage. The chart plots the previous 60 points in time in which system usage data was polled, and scrolls from right to left, so the left-most data point is the oldest while the right-most is the newest. The vertical divisions on the chart represent 25% marks, so the baseline is 0% and the top of the chart is 100%.
Drive Module
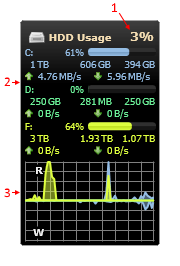
The drive module contains data about long term storage devices connected to your host system. You can monitor hard drives, SSD drives, CD-ROM/DVD drives, USB devices ... whatever you have. The layout of the module is similar to the CPU module above:
- Overall drive activity presented as a percent. This is an average of the activity levels of all devices currently monitored by Recap.
- Drive usage data. This is the collection of devices you want to monitor, each identified by its drive letter. The device capacity is presented as a percentage with a visual bar indicator to the right, below which are numerics which indicate Total Capacity, Used Space, and Free Space respectively. Below the numerics are current I/O data rates on the device indicated with an up arrow (read) and a down arrow (write). Devices which are not currently connected to your host system will not be present in the drive module until they are connected. This includes all USB devices and devices with removable media like CD/DVD players.
- Drive Chart. This chart is a little different from the CPU chart above. Each device you are currently monitoring in the module has a color-corresponding data series in this chart. The baseline of the chart is in the center, and like the CPU chart each horizontal indicator line represents 25%, so the measurements go from 0-100% above the baseline, and 0-100% below the baseline. This chart does not represent capacity or data rate of your device, but rather it shows device "activity level" as a measure of the amount of time during the polling interval that the device was busy. Read activity is presented ABOVE the baseline, while Write activity is presented BELOW the baseline (there are helpful R/W labels in the UI as a reminder).
Module Placement
Each module in Recap is an independent window which can be placed wherever you desire on your desktop. To help you place the modules in an orderly manner, the windows will "snap" to certain pre-defined locations on your desktop as they are dragged near. Those locations are
- The corners of every monitor attached to your system.
- The upper-right and lower-left corner of any other visible Recap module.
Try it and you will immediately see how it works. Intuitive and easy.
Occasionally your desktop geometry will change. (Yes, I'm looking at you laptop owners) Recap remembers the various desktop geometries that it has encountered on your host system, and when your desktop changes (adding or removing a monitor, plugging into a docking station, etc...) it automatically rearranges the module windows according to the last layout saved for the "new" geometry. When your desktop geometry changes to one not encountered before, Recap resets all modules to the upper-left hand corner of your primary monitor allowing you to then re-place the modules as you desire. That new layout is then saved in your Recap preferences and becomes "known" for future desktop geometry changes.
System Tray

Recap will have an icon in your System Tray while running. You can left-click that icon to launch the Recap Control Panel, or right-click it for a context menu of options.
Control Panel
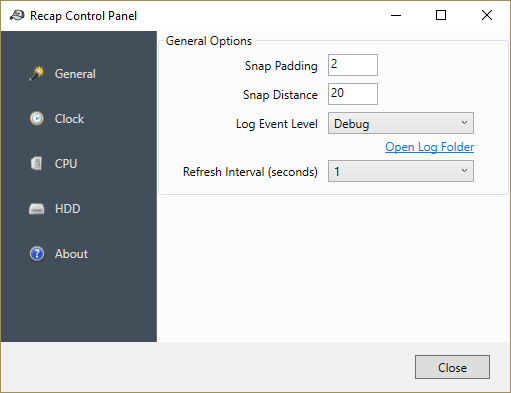
Snap Padding / Distance - Module snapping was described in the previous "Module Placement" section. These settings allow you to adjust how aggressive the snapping is on your system. Padding is the number of pixels between modules, while Distance is the distance (in pixels) at which a snap will occur.
Log Event Level - Recap maintains a running log file of its operation for the past 3-days. You can adjust the aggressiveness of logging using this control panel item. Changing this setting will have an immediate effect on log data collection, there is no need to restart the application. The "Open Log Folder" link below will open the folder on your host system which contains the log files.
Refresh Interval - Recap operates by polling your system resources over time. Changing this setting will tell Recap how often to poll your system resources, and therefore how often to update the UI with new data.
Warning: Some maths ahead! Changing this refresh interval affects the rate at which data is accumulated in the charts of various modules. The charts of the CPU and Drive modules plot 60 data points for each series. If your refresh interval is 1s, then 60 * 1s = 60s = 1m, so the chart represents 1m of chart data. If 5s, then 60 * 5s = 300s = 5m of chart data ... a 10s interval = 10m of chart data ... I think you see how this works. For any interval of "x" seconds, the chart represents "x" minutes of data.
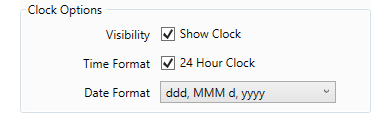
Visibility - Disabling this option will hide the clock module.
Time Format - Switch between 24 and 12 hour formats.
Date Format - Set your preferred date format.
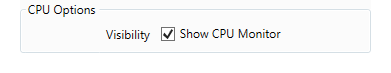
Visibility - Disabling this option will hide the CPU module.
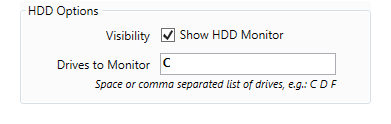
Visibility - Disabling this option will hide the HDD module.
Drives to Monitor - This is a whitespace or comma separated list of the devices you want to monitor. You can enter device letters that do not currently exist on your system for CD, DVD, and USB media.
Known Problems
No software is perfect. Here are some of the things that are peculiar about Recap:
- If your refresh interval is set aggressively and you watch closely, you may see Recap skip a beat. In an effort to be non-intrusive on your host system, I've decided that Recap is the "least important thing" running, as such if the OS gets busy with other applications it may decide to delay a Recap polling interval until a more convenient time. There is little rhyme or reason behind how and when this happens. I've seen Recap skip a beat when system resources appeared un-taxed, and later seen Recap perform perfectly when all cores were running at peak.
- Occasionally when changing desktop geometries Recap will get confused and place your modules at odd locations. I've seen this more often on laptops connecting to thunderbolt docking station. Research is ongoing to find the root cause.
- CD/DVD devices don't always report I/O rates. The result in Recap is that the Read/Write rates in the drive module will be blank, and the resulting data series in the chart will never move from the baseline. I suspect that the data rates are available, but merely recorded in a different way, and am hopeful that this bug will be resolved soon.
- Occasionally, when adding/removing CD/DVD/USB media, the drive module internal layout engine will get confused. The visible window will clip off the bottom part of the chart, but the window "thinks" its content fills the "shadow" area indicated to the left (which you can see when you drag the module and observe where it snaps). The only known fixes for this are to either (a) restart Recap, or (b) use the Control Panel to Hide, then Show the HDD module. (v1.0.7.0)
Special Thanks
Recap, like most modern software, is built on the shoulders of giants ... open source projects created and maintained by passionate developers. Below is a list of projects that made Recap possible:
- Json.NET - A world-class JSON serialization framework.
- Serilog + sinks - The definitive structured log library for .NET.
- WPF Notifyicon - A nice library for dealing with system tray icons. I keep wondering why this is not a native part of .NET.
- Stashbox - An unbelievably fast IOC container framework for .NET.